Table Structure Recognition Models Compared on Spanning Cells
Metric choice and dataset quality reveal which models truly handle merged cells best.
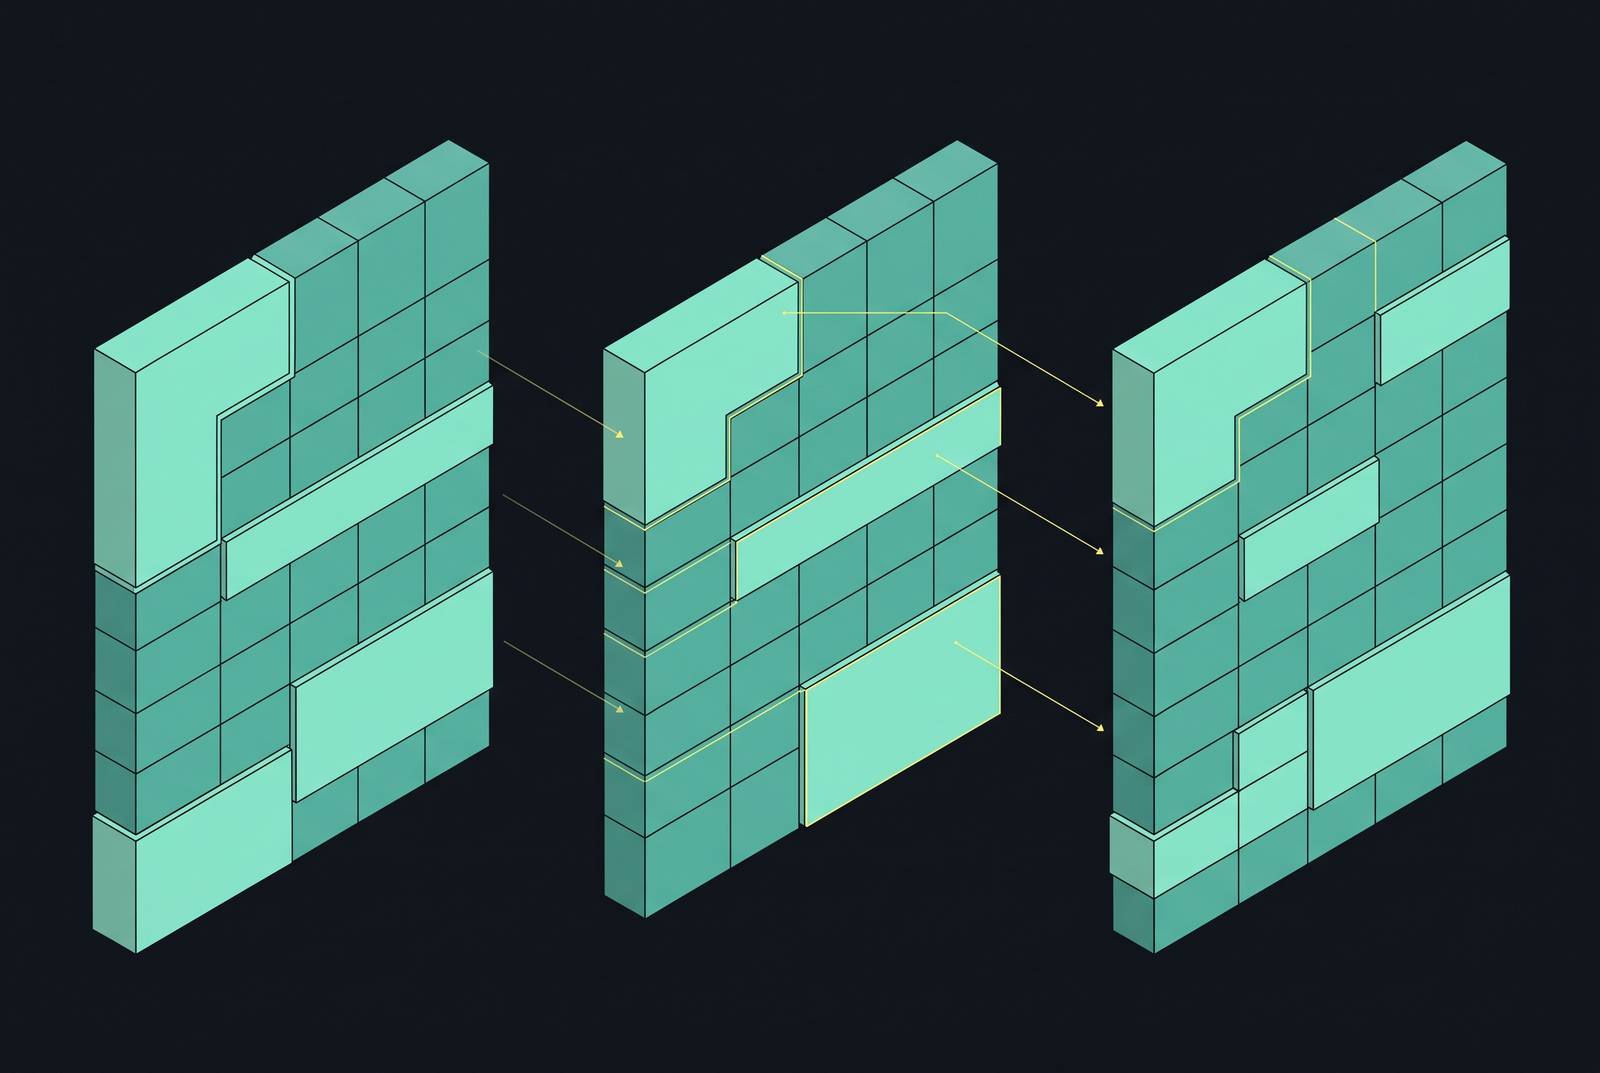
No part of table structure recognition gives a system more trouble than Spanning cells, those merged rows and columns you see in every scientific table or earnings sheet. They fall where the leading methods, object detection and sequence generation, both struggle, and seeing how varied models deal with them says more about practical trust than any ranking score alone.
(TSR), or Table structure recognition, converts table pictures into machine-readable output like HTML so downstream tools can query, scan, or pass them along. They spot each little square and the borders between them, then use simple logic to sort everything into a grid. They avoid that process and output the grid layout in order, like an LLM writes words. Both approaches fail when one cell stretches over multiple rows or columns. Box-finding systems depend on row-and-column matching made for an even layout, and any joined area in an odd spot makes it fail. Approaches like TGRNet spot regions by following the borders drawn between them, yet one that covers several has nothing inside to detect. It finds no cell. It finds an empty space it cannot interpret.
Older systems said it clearly: joined boxes, or any image problem, made their results worse. That matters for far more than just keeping score. In finance filings, spanning headers let one term cover several columns. In Scientific tables, rowspans attach one technique label to multiple data rows. Public filings rely on multi-column headers too. When a system mishandles spanning cells, the breakdown isn't on the margins. It breaks on the exact documents users most want parsed.
How the field measures spanning-cell recovery and why the choice of metric changes the answer
Which system handles spanning cells most effectively comes down to the yardstick you choose, and the wrong choice points you to the wrong system. Most papers use the metric TEDS (Tree-Edit-Distance-Based Similarity). It scores how far the model's HTML sits from the ground-truth version: 1 less EditDist(T_pr, T_gt), scaled by whichever is bigger. When checking spanning-cell accuracy, TEDS-Struct is what matters because it strips the text from each cell and scores only structure.
PubTables-1M uses GriTS_Top, a yardstick that scores grid topology and can highlight rowspan and colspan errors. F1 asks if each touching duo is joined right, but it can miss a key failure: a system can get a shared area totally wrong and still show a high F1, because it adds up local joins rather than the whole grid at once. Rely on that score too heavily and you end up choosing a system that passes adjacency but fails at the actual topic here.
This caveat matters, and the wider field still hasn't come to terms with it. Benchmarks for Complex-scene work, including WTW plus ICDAR-2019, use TEDS-Struct and F1-Measure since they hold much more distortion and spanning cells than any scientific-document group. Nor are those benchmarks free of errors. FinTabNet shows documented annotation issues, particularly with multi-row spanning cells. Certain models get marked "wrong" when the labels are bad.
Studies shared near ICDAR 2023 looked at results after fixing those mistakes and getting datasets aligned. On ICDAR-2013, TATR's exact-match accuracy climbed to 75% from 65% when trained on PubTables-1M. Using FinTabNet for training pushed it from 42% up to 65%. Together, the figure went up to 81% from 69%. Public score tables mostly show differences in test data quality rather than real algorithm improvements, so reading them that way is wrong. See what metric a figure came from and which dataset edition was used before reading anything into it.
The benchmark datasets practitioners actually encounter and what each one stresses
Most papers begin with PubTabNet: 500,777 images for model fitting, validation gets 9,115, evaluation gets 9,138, all from scientific documents containing borderless cells plus spanning and empty cells, with varying numbers of rows and columns. It's scored with TEDS and TEDS-Struct, and it functions as the closest thing the field has to a common language for "how good is this model at complex structure."
FinTabNet draws on 112,887 financial-report tables taken from one-page PDFs, labeled down to individual cells. This issue counts most here: pictures with multi-row spanning cells often have annotation errors, which can affect test clarity. Certain models struggle with recurring failure spots in financial tables.
PubTables-1M goes further, with 758,849 documents for model fitting, validation uses 94,959, and evaluation uses 93,834, split at the document level. GriTS_Top is designed to evaluate grid-topology errors, including spanning-cell correctness.
SciTSR, drawn from scientific PDFs in a 12,000-to-3,000 split, presents fewer challenges for spanning cells found in photographed or scanned documents.
WTW poses a tougher challenge, scored via TEDS-Struct and F1-Measure. These benchmarks are among the most challenging for merged cells. If it only sees PubTabNet, it doesn't meet conditions often found across financial papers plus documents camera-captured, so the score can't be treated as if it did.
How the grid-based family handles spanning cells: SPLERGE, TRUST, and SEM
Some methods do this by putting the table structure back together, then picking which boxes next to each other should join. SPLERGE set up the approach by splitting the page into a grid based on the table's rows plus columns, with merging cells done where layout required it. TRUST came next, using its query-based splitting module alongside the vertex-based merging module, designed to improve spanning-cell predictions. SEM built further by folding in textual cues alongside what the eye sees when choosing which adjacent cells to merge, instead of relying only on layout.
They all have the same problem, and not a small one: merge only happens when its grid was found correctly. When a picture is distorted or the table is borderless, that initial step fails, and all spanning-cell problems downstream trace to it. The divide-first approach can only match the quality of its first stage, and clever later steps never rescue a foundation laid down badly.
The upside is the opposite, though. Splitting first and merging second makes the method transparent, so someone running it can spot a failure's origin rather than guess at what the model did. This auditability matters more than a small rise in results, mainly for any pipeline people must debug if a document returns bad.
TSRFormer: reformulating separator prediction to handle distortion and spanning cells
At ACM MM 2022, TSRFormer took a fundamentally new approach. Rather than splitting the picture to spot dividing marks, it treats separator estimation as a regression task, built on a DETR-based module with two stages named SepRETR. A couple of steps make it happen: prior-enhanced pairing that fixes the convergence problems DETR often has, plus cross-attention over high-resolution convolutional layers, giving precise localization of separators without a big compute cost. After separators get set, the relation-network-based merging module handles recovery of spanning-cell regions.
When it came out, TSRFormer did best on SciTSR and PubTabNet, plus WTW, while the team also checked how it handled tables without ruling lines, big open areas, missing or joined entries, and bent layouts, with their own field data and open test sets. Because WTW is a benchmark packed full of spans plus distortion, that score matters more. A top result there counts as a real victory with messy documents rather than a clean-document success made to look harder. That sign shows the model holds firm under exactly those conditions in which the paradigm's papers expect trouble.
LORE and LORE++: logical location as an alternative to adjacency, and what that change reveals about spanning-cell failures
The 2023 AAAI paper LORE, plus the LORE++ follow-up, go an entirely different way. LORE does not classify relations between neighboring cells; it predicts every cell's logical location: row position, column position, plus rowspan and colspan. LORE hits 98.1% TEDS on PubTabNet compared to the 89.9% from EDD's model, while being trained with markedly less data than what EDD required.
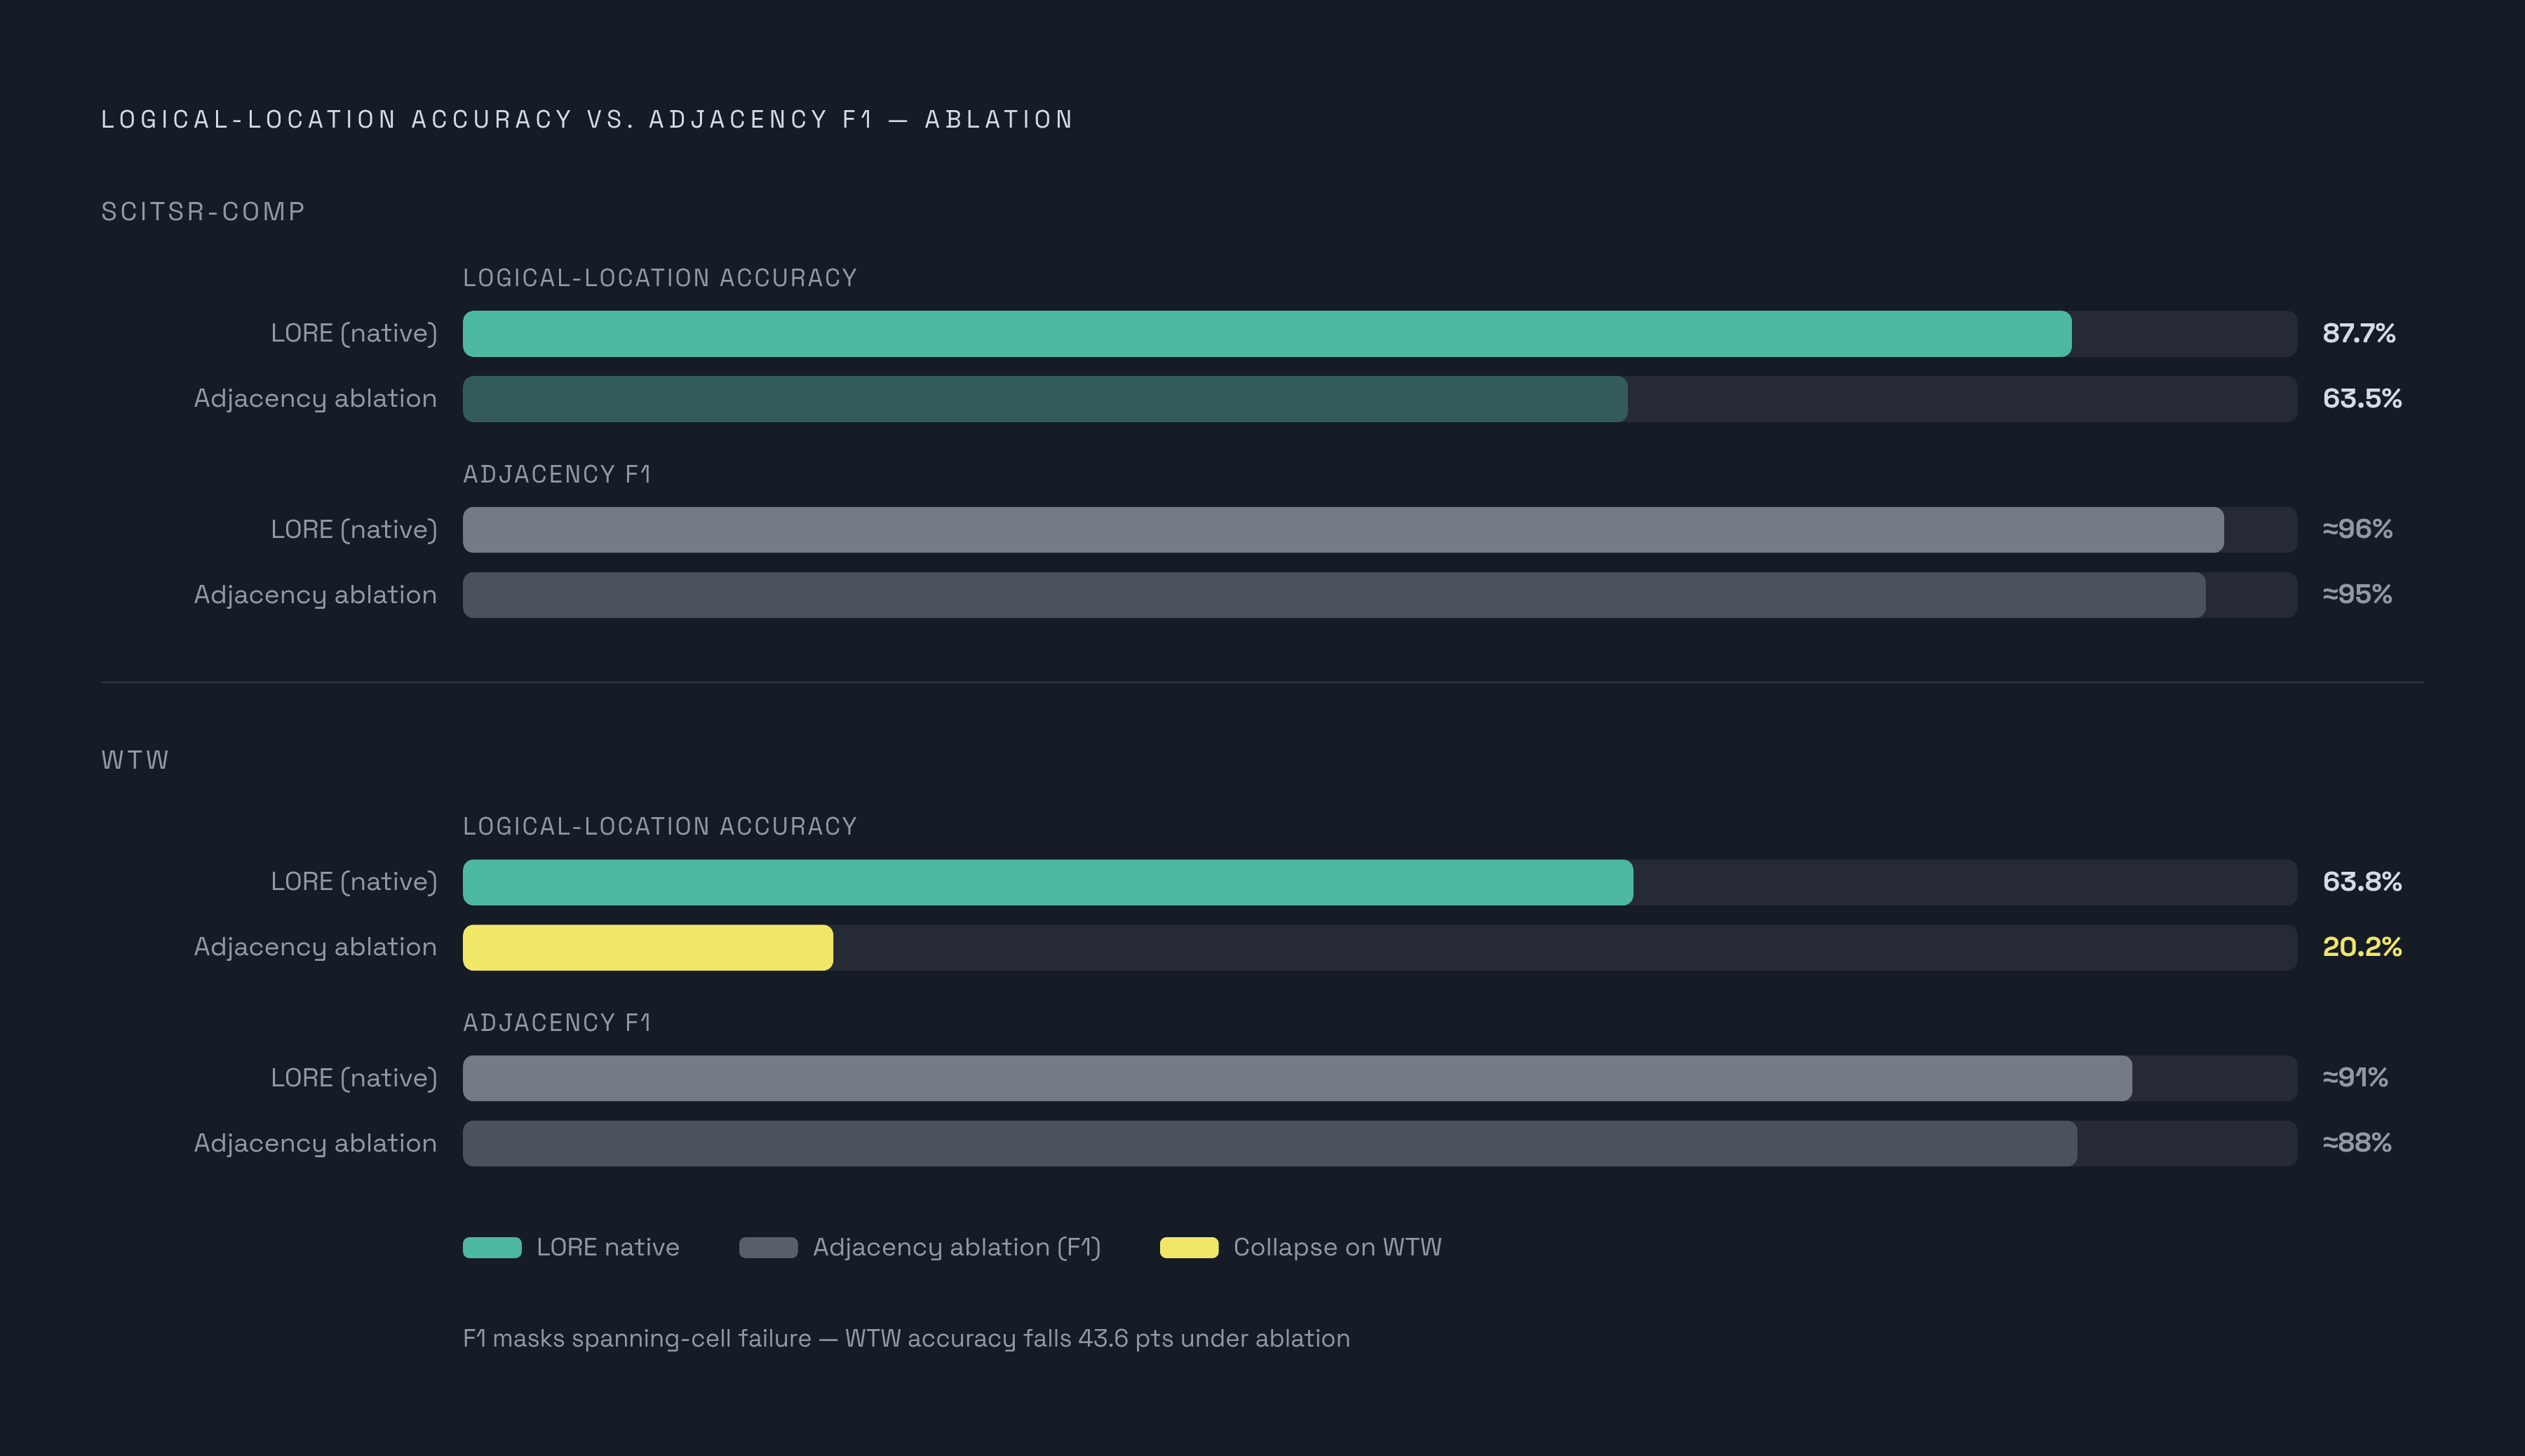
Across LORE papers, the strongest proof is one quieter value under the main TEDS score. You'll find this quieter figure hidden inside those ablation tables. LORE was made to reconstruct tables as prior methods did, with adjacency tagging and heuristic steps, thereby replicating their approach. For spanning cells, Logical-location accuracy collapsed: SciTSR-comp fell 87.7% to 63.5%, while WTW dropped 63.8% to 20.2%. The altered version held a strong adjacency F1 throughout. The figures show F1 can miss the important problems.
WTW dropped harder, falling to 20.2% from 63.8%, and it shows what SciTSR-comp alone leaves out. The distance between the two approaches actually shifts. The gap grows as tables get tougher: more merged cells, more skew, more ways a link-prediction model can break while F1 still looks fine. Specifically, LORE stays ahead on WTW and ICDAR-2019 benchmarks, since adjacency reconstruction has the hardest time there. Choose one based on adjacency F1 from plain scientific tables; you risk handing a scanned-document or financial-statement pipeline something it can't use.
TableFormer and TFLOP: attention mechanisms applied to spanning-cell topology
At CVPR 2022, TableFormer set a solid pre-LORE baseline through its transformer encoder-decoder architecture. With FinTabNet TEDS-Struct the model hit 97.50% for basic tables and 96.00% for harder ones, reaching 96.80% in total, a high mark in spanning-cell recovery for finance documents when it came out.
TFLOP, the TSR Framework built around a Layout Pointer, showed up in the IJCAI 2024 proceedings and then on arXiv during 2025, and a different tack is what it takes, reformulating how text-region pairs are linked: prediction becomes a pointer task instead of a label one. It uses its span-aware contrastive supervision specifically for sharpened pointer behavior on difficult tables, and the authors report correctly recognizing hierarchical rowspans along with colspans that are hierarchical, near the hardest spanning-cell configurations. On PubTabNet, FinTabNet, and the SynthTabNet set, TFLOP hits state-of-the-art results, while on documents with watermarks or non-English text it turns in strong numbers.
LORE's ablation revealed a key limitation that span-aware contrastive supervision addresses: cells that appear similar but occupy different span positions. Span-aware contrastive supervision helps address this challenge. This approach specifically targets a known limitation.
FastTab: grid-centric speed without giving up spanning-cell topology
FastTab hit arXiv in May 2026 and chases a totally separate constraint: running fast while still keeping the topology accuracy that only a grid-based method earns. The method skips autoregressive HTML decoding entirely, pairing the lightweight Tiny Recursive Module to think about whole tables with axial 1D transformer encoders tracking long-range dependencies across rows plus columns.
Spanning-cell inference is simple: estimate row plus column numbers, with header rows alongside separators for a grid; then infer rowspan with colspan from ROI-aligned cell data. FastTab's GriTS_Top on PubTables-1M is 98.27, a measure built specifically to catch spanning-cell and grid-topology errors. It hits 99.5 F1 on SciTSR, tying the top published score. Its big point: throughput, 39.50 FPS on an A100 with 1 item at a time, making it real-time. The authors tested robustness through pixel-level anonymization, plus adapted their method to handle curved separators in documents that are camera-captured.
GriTS_Top at 98.27, paired at 39.50 FPS, makes the real case for it. Similar topology scores come from many architectures. Very few do it that fast, and that is just what a pipeline handling many filings each day requires but won’t see from any slower comparable competitor.
TableSeq and the unified-generation approach: what joint structure-content decoding costs on hard spans
IJDAR released TableSeq during May 2026, going the other way on architectural design from FastTab's pipeline: a single autoregressive decoder gives out interleaved HTML tags alongside cell text plus discretized coordinate tokens together, without any outside OCR tool, extra auxiliary decoder, or the multi-stage finishing work grid-based methods need. Its encoder stays small: one lightweight high-resolution FCN-H16 backbone plus a basic structure-prior module and one transformer encoder with a single layer.
These scores stay strong. PubTabNet: 95.23 TEDS, with S-TEDS at 96.83. On FinTabNet: 98.69 S-TEDS and 97.45 TEDS. On SciTSR with CAR: 99.79 exactness, 99.54 coverage, 99.66 F1. But the authors are honest about where it still falls short: certain complex span configurations remain challenging, and FinTabNet specifically still shows trouble with the stub column on the left and a blank header, even alongside those top-line scores.
Those scores matter less than such candor. Folding structure, layout, and text into a single stream is elegant, yet the failure modes listed say ambiguous spans stay hard even as things get simpler. The authors behind TableSeq's also tested blockwise decoding using multi-token prediction, bringing inference latency down with only a slight accuracy drop, showing this unified-decoding method can still narrow its gap for hard spans while keeping its pace edge.
Vision LLMs and the NGTR framework: a different class of model, a different class of constraint
Vision-language models come at this task with their own gear and their own boundaries. While TSR models that are grid-based or sequence-based get trained narrowly to handle table structure alone, any vision LLM has broad pretraining covering images plus text, with parsing as just one thing it can try. NGTR framework uses that wider training to apply an image-and-text LLM’s broad skills to TSR, even where custom TSR systems miss joined cells.
That tradeoff exists, and we can't just get it waved off. FastTab's row and column features and TSRFormer's line placement put that grid-topology inductive bias in on purpose; a generic LLM won't carry it, so how well it does on big cells that cross the grid turns on how much of that setup comes back during training. Don't expect a vision LLM to close that gap which purpose-built models narrowed over many cycles: broad pretraining can't replace grid-topology focus, something TFLOP plus LORE alongside FastTab all bake into their designs. The community is just starting to put that question to TEDS and GriTS, Top, plus harder datasets such as WTW, which have already shown where older architectures fell short.
Sources
- Enhancing Table Recognition with Vision LLMs: A Benchmark and Neighbor-Guided Toolchain Reasoner
- TSRFormer | Proceedings of the 30th ACM International Conference on Multimedia
- Aligning Benchmark Datasets for Table Structure Recognition | Springer Nature Link
- Tableseq: unified generation of structure, content, and layout | International Journal on Document Analysis and Recognition (IJDAR) | Springer Nature Link
- arxiv.org
- arxiv.org
- ijcai.org
- Evaluating Table Structure Recognition: A New Perspective