Chart and Figure Data Extraction From PDF Reports
Modern tools combining OCR and vision models now extract chart data from PDFs as structured tables.

Chart data trapped inside a PDF report is a different challenge from words trapped inside a PDF report. Text stays as letters below the rendering, yet a chart is just an image with no digits a machine can parse. That gap seems minor until document processing staff must get the image into one spreadsheet. The upside, and what this article is really about, is that today's extraction tools put OCR, vision-language models, and layout analysis to work on those pictures, so they come out as usable tables. The rest of this article explains how the pipeline works, what current accuracy data indicates, plus where that technology still requires manual review.
Pulling chart data by hand is a real slog. A person pulls up the PDF file, zooms in on a chart, then begins typing figures into a spreadsheet manually, guessing at values sitting between gridlines. Copy-paste usually falls short on a sheet containing merged cells, smashing every column into one jumbled mess. Scanned PDFs add to the problem, because nothing is selectable until recognition happens, and before that each chart remains only an image of an image. Multi-column layouts, nested tables, axis labels, color codes, and chart keys all push a naive text-extraction run into wrecking the very arrangement that made those values readable. The 2026 CHI Conference paper "Making Multimodal LLMs Reliable Chart Data Extractors" makes the underlying stakes plain: charts are a primary way quantitative information gets communicated across scientific publications, business reports, and policy documents. When it remains stuck inside a picture, it's wasted or entered by hand all over again, and every round of retyping is an opening for a switched digit or a decimal read wrong to leak downstream.
The extraction pipeline works like this: PDF upload through to structured output.
Most advanced extraction tools follow a similar four-stage workflow. The opening phase extracts words: a PDF made from regular content lets software grab it immediately, while any scanned or photographed sheet requires OCR to convert pixels so they become machine-readable. Next comes layout analysis: figuring which parts are titles, which are tables, where one section ends and another begins, and the sequence a person would naturally follow. Without it, what's extracted turns into a scrambled pile of values that don't connect. Step three extracts the real data: table cells, values for axes, labels, applying pattern recognition and named entity recognition for determining what each figure means in context. Stage four hands back the output in a usable shape: JSON feeding an API pipeline, CSV plus Excel, or a cited reply for manual review.
Charts call for another layer beyond that usual pipeline. VLMs, or Vision-language models, read every chart as a picture and build a structured table without attempting to extract words. From Copenhagen Research Centre, PlotPick arrived in May 2026 as an open-source tool doing this: using PyMuPDF, it parses uploaded PDFs, reads captions from each bounding box, cuts out the chart, and gives the image to a VLM, using this plain-language prompt: extract chart data as one tab-separated table. This output is returned in editable table form, allowing reviewers to identify entries that may require verification.
The stronger tools do more than spit words out. They hand back tidy, structured JSON that pulls headings, paragraphs, tables, and figures apart, so the results drop straight into automated downstream processing without another post-processing step. Tools now handle extraction without templates, so the system adapts when it sees an unfamiliar document type and nobody has to create a template ahead of time. The semantic layer, using NLP, helps it recognize a value as income, an ID number, or a day, which raw OCR cannot manage alone.
What the benchmarks show about current accuracy
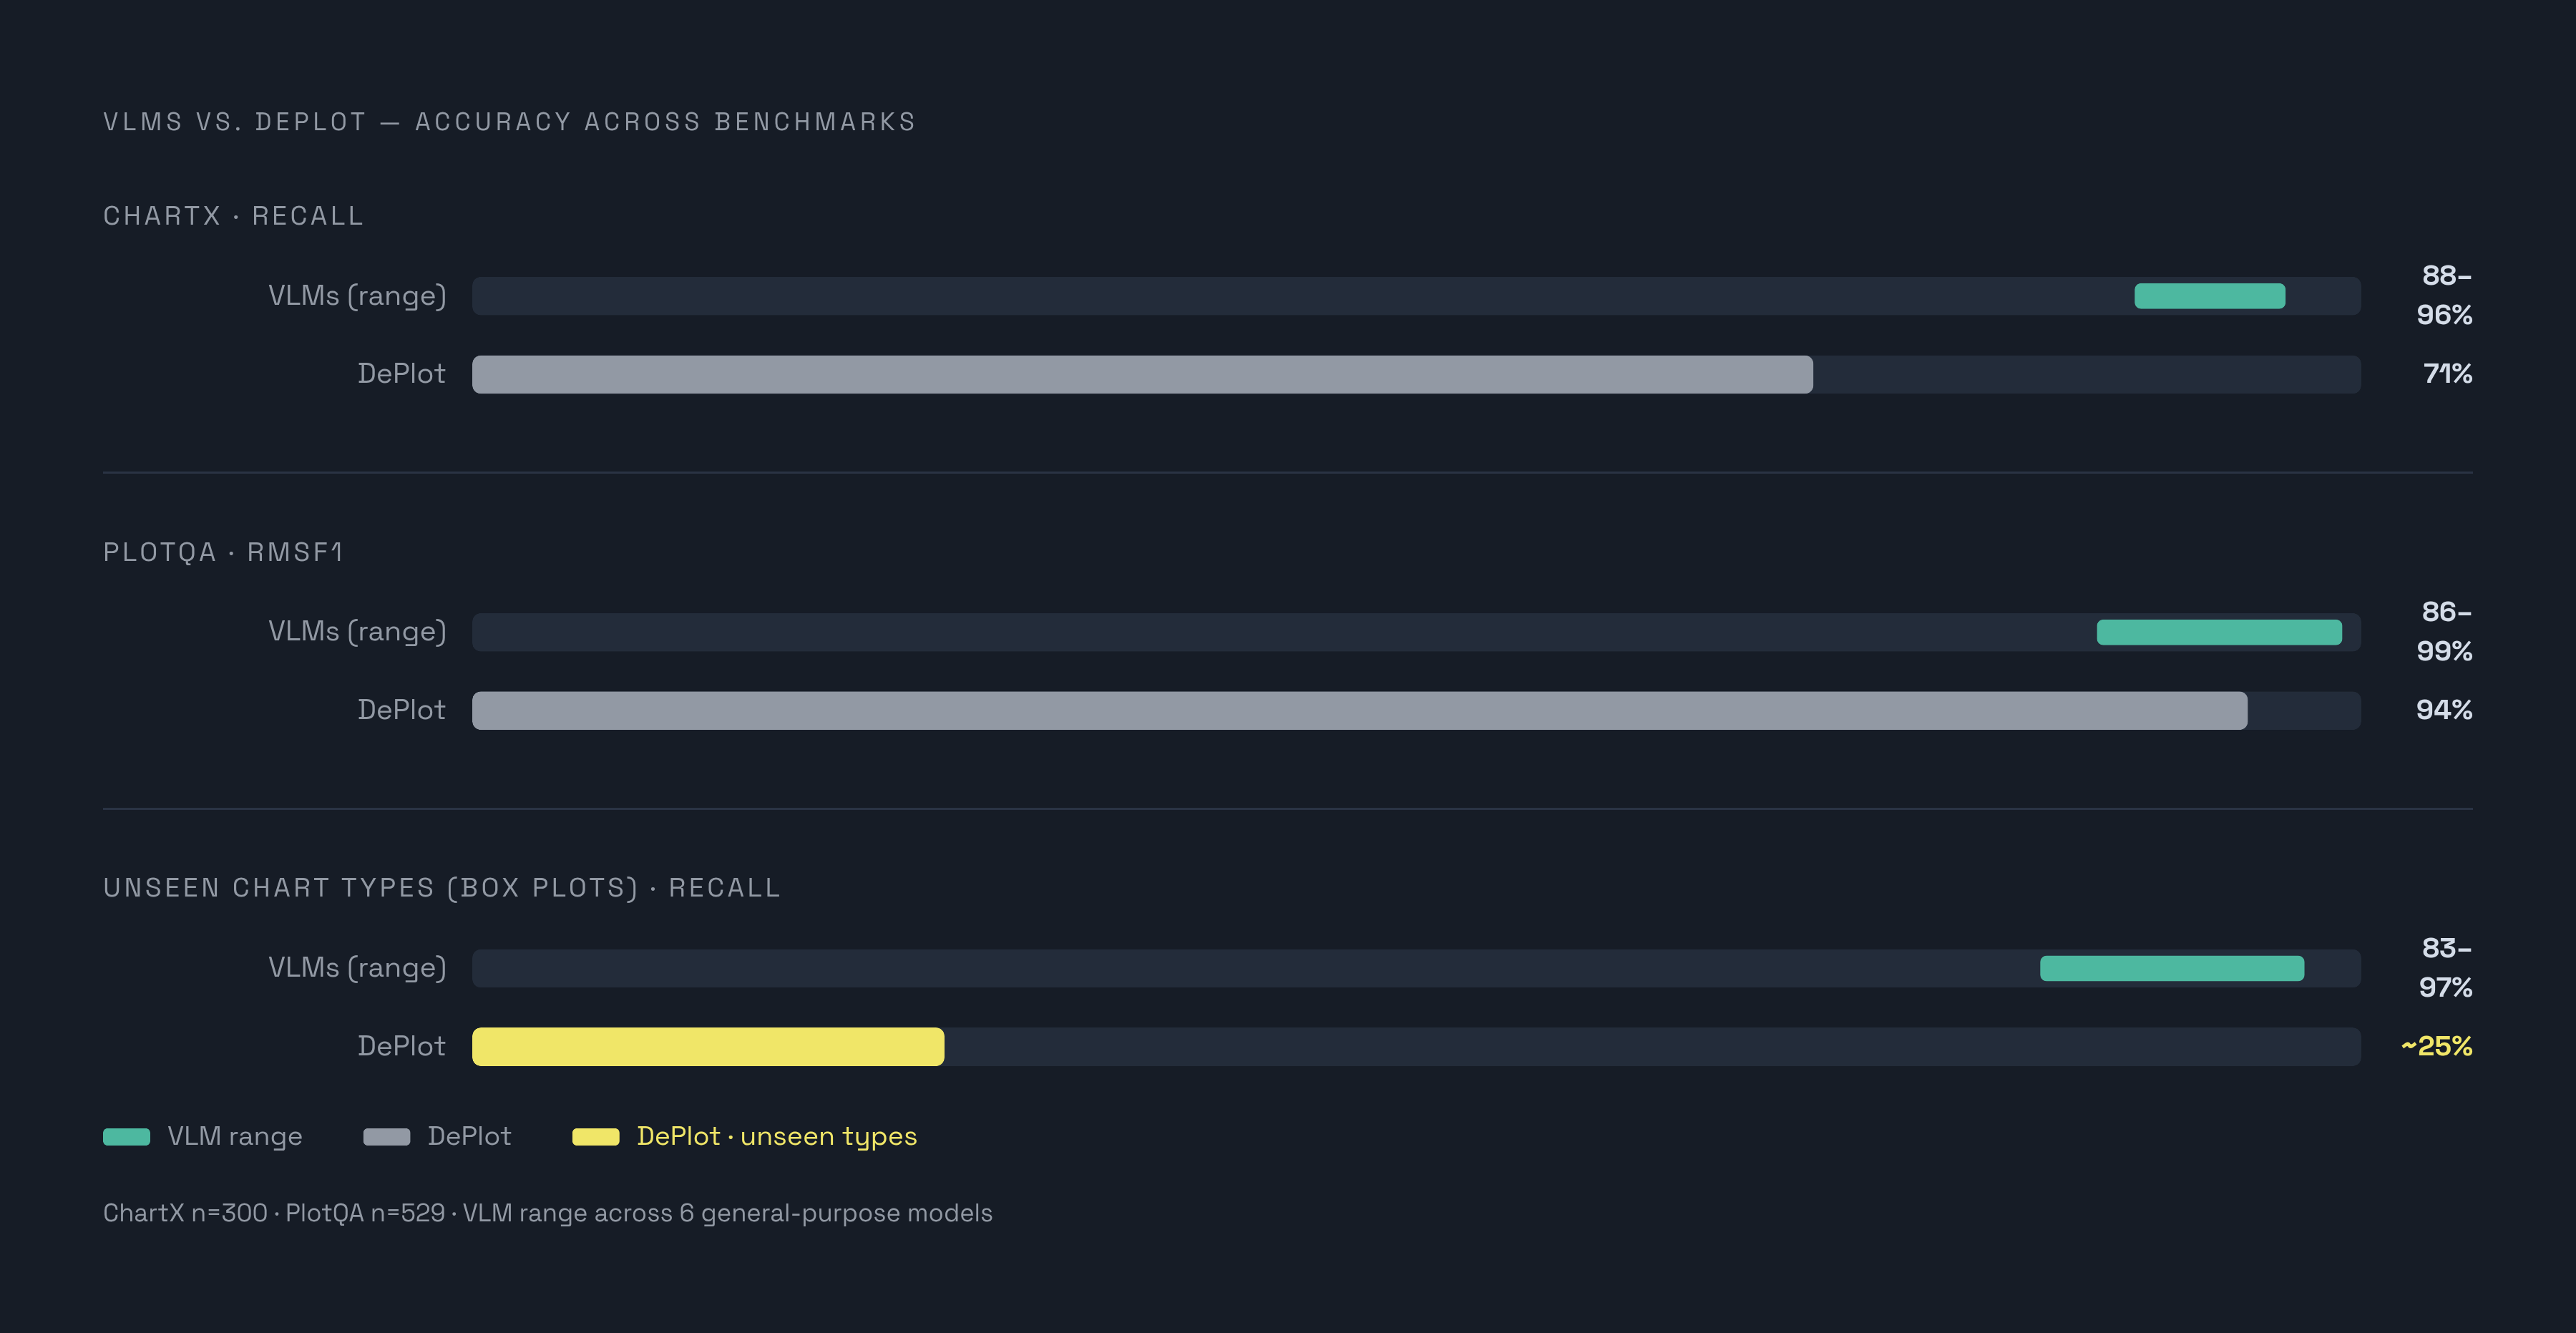
In May 2026, PlotPick evaluated six VLMs from multiple providers on PlotQA and ChartX, benchmarking them against DePlot, a specialized chart-to-table tool. DePlot fell behind the six VLMs across the two benchmarks. Running 300 test cases through ChartX, including histograms, box plots, plus column and trend charts, those VLMs reached 88 to 96% recall versus 71% for DePlot. On PlotQA's 529-sample set, the models landed between 86 and 99% RMSF1, compared to DePlot's 94% score. On charts DePlot never saw in training, DePlot's accuracy falls to about a fourth of what those VLMs manage, which hit 83 to 97% recall for box plots. So what's the takeaway? An AI built only for certain chart kinds fails quickly when it sees a new one, while a broad VLM gives up some top precision on known chart forms for much better handling of new ones.
Benchmark data alone doesn't show the full picture, though. During May 2025, folks at Karlsruhe Institute of Technology plus University of Oxford released CHAOS, running 13 multimodal LLMs on pictures messed up on purpose: blurry copies, dark photos, dots, words stacked together. CHAOS tested every system against 5 textual perturbation categories plus 10 kinds of visual noise, each across 3 severity settings from mild to severe. None of the tested tools held accuracy, and degradation hit each differently. Document-specific models alongside chart-specific models broke down in distinct ways compared to general-purpose ones. Perfect test results barely hint at whether software can read a blurry PDF buried in someone's old files.
PlotPick noticed that a one-line prompt lands close to a multi-rule prompt built for clean charts. Picking the right model shapes extraction accuracy more than tweaking the prompt, for charts that haven't already been degraded. Extraction accuracy stays strong for standard, clear chart types but falls meaningfully when handling scanned or low-contrast and odd figures. Any provider calling its product flawless extraction everywhere needs testing on the document types people really handle, not on tidy benchmark charts.
Things to check while evaluating extraction tools for actual report workflows
A few factors genuinely set tools apart in everyday work, not in a vendor pitch. OCR accuracy with low-resolution inputs and scanned files truly separates tools, as every vendor already handles PDFs without trouble. Table handling comes after that: many tools break down on nested tables, merged cells, plus multi-column layouts. For anything involving charts specifically, ask whether the tool treats the figure as an image and extracts the underlying axis values, or whether it just pulls the caption text sitting next to the figure and calls that "extraction." Batch processing matters too. Can this tool handle 50 documents at once, or does each item require manual work? Finally, check output choices. Teams building automated pipelines need JSON, analysts doing it themselves use CSV or Excel, and cited answers help anyone doing manual review.
Workflow matters just like raw accuracy, if not more. A precise tool requiring a data expert to configure delivers fewer benefits to a firm than a somewhat worse one non-technical staff can start using immediately. Vendor checks on data handling call for procurement-level review, especially when client projects contain proprietary analytics and commercially significant figures: processing rules plus data retention conditions count as the real deal, not small print. Parseur pointed toward Scoop Market research saying IDP can reduce mistakes at least 52%. Hold each tool to that bar, the manual error rate already in play day to day, not an imagined ideal.
The ten tools worth comparing in 2026, with their best-fit use cases
The July 2026 tested piece from Powerdrill.ai, plus the May 2026 guide by Denser.ai, address some of the same points here, and any difference between them should be called out, not hidden.
Powerdrill Bloom pulls dense documents apart for extraction and review, showing flawless handling of merged or nested tables in tests, letting it cross-reference several documents together and shape extracted data into charts or decks without coding. The persistent Workspaces keep uploaded PDFs, Excel, TSVs, CSVs, pictures, sound, and clips between visits. Reviews showed unmatched accuracy when extracting tables, plus a UI intuitive to the point where AI hallucination disappears. The tradeoff: it can feel like overkill for anyone just looking over plain text. It's free to try, with costs beginning from $13.27 each billing cycle.
PDF.ai is useful for fast Q&A plus summarization for one text-heavy document through conversational chat and Chrome support. It’s not good at big table extraction jobs and it’s weak on batch processing. A Free tier exists, and Pro costs $49 monthly.
It’s strongest for general research combining PDF files with current online data, plus cited results and Copilot help. It isn't designed as a specialized extraction tool; spreadsheet output isn't possible, and document formatting is frequently dropped. A free plan is offered, and Pro costs $34 monthly.
Scholarcy focuses specifically on academic research and reading summaries, offering automated flashcard creation, citation extraction, summarization of key-points, and links to bibliography tools. It specializes in one area and handles raw numbers badly. Free tier available, Premium costs a modest monthly fee.
It works for law and research teams looking through large files for exact replies, with cited pages and a split chat and reading view, made for tight safety rules. Outputting to CSV or Excel is limited, while credit-based pricing gets expensive quickly. There's a free plan, with Premium available for a modest fee per billing cycle.
Lido uses automated workflows to move PDF data onto spreadsheets, adding custom formulas that consolidate data from several sources. Anyone non-technical will find it steep to pick up, and there's no actual layer for conversational AI. Starts at $29 a month.
This tool handles bills and organized money files, letting users adjust AI OCR, link an API to ERP software, and run data checks that work fine on normal pages. Getting started calls for know-how; it isn’t made for handling unstructured content. Custom enterprise pricing.
Docsumo serves business underwriting plus document automation for the financial-sector, using pre-trained models on money-related documents, dishonesty checks, and enterprise-grade straight-through processing. Custom enterprise pricing.
Parseur uses set forms to pull data from messages plus PDF files, supports large file counts, and links to other tools. Pricing is custom.
Doxis suits enterprise-scale ecosystem control, handling document workflows through layered organizational setups. Custom enterprise pricing.
Teams building a shortlist should check Denser.ai's 2026 guide, which adds Denser, Docparser, and Adobe PDF Extract API to those tools. For people pulling figures in bulk from PDFs who don't want to pay for a license, the free program PlotPick, noted above, stands apart from the research work and deserves a mention here.
How extracted chart data matters outside a spreadsheet: AI visibility link
Pulling a figure from a PDF to a spreadsheet marks just the start. Research by Princeton, Georgia Tech, IIT Delhi, and Allen Institute teams (KDD 2024) found that pages with verified statistics and named sources achieve 30–40% higher AI visibility. Quotations, another GEO tactic, increased visibility by 41%. That tactic relies on a cleanly extracted PDF report chart as its raw input.
A number hidden inside the client's PDF report is extracted accurately, then gets embedded within a cited statistic on an article that AI tools later cite to handle matching queries. Data locked inside a PDF or big graphics stays invisible to AI systems building responses, so clean, organized results from an extraction tool come first, not last.
When agencies juggling many client brands grow, it matters a lot. How quickly a group can move through their clients' PDF files, data exports, audit results, and rival research decks controls both how soon data-heavy material goes live and how it lands on AI platforms later. Some tools close the cycle by turning pulled data into posts, pushing those pieces live across AI channels, and tracking which brands are cited and what discussions mention them. That makes an extraction workflow carry a measurable AI visibility result, not just a single spreadsheet job.
This problem is genuine and largely unaddressed. Many brands still lack a systematic way to track their AI visibility. Teams that link source mining to content with real tracking can better show their results count for customers who lack any view of it.
Accuracy gaps that still need checking
Extraction workflows break when they act as though this stuff replaces a live reviewer, which it doesn't. Messy or subpar input files are still the main weak spot: scanned pages with bad lighting, lens flaws, or poor resolution throw off even the top multimodal systems, and CHAOS benchmark data makes that plain. Any workflow assuming equal accuracy for every document relies on something the data won't back.
The solution stays simple, though tedious. Add a manual review for cases that benchmarks mark as problems: scanned files, not born-digital, unconventional chart type cases, or per-row trust numbers that rate poorly when the tool gives them, like PlotPick. Send those to a person before they become spreadsheet entries or statistics. Skipping the check lets an error spread beyond one line in a single table. One extraction error compounds, becoming a cited statistic which an AI engine repeats as truth.
Sources
- 10 Best AI Tools for PDF Data Extraction and Analysis (Tested in 2026)
- How to Automatically Extract Data from PDFs with AI | Parseur®
- CHAOS: Chart Analysis with Outlier Samples
- AI PDF Data Extraction: How It Works + 6 Tools to Compare
- PlotPick: AI-powered batch extraction of numerical data from scientific figures
- dl.acm.org