Table-to-Markdown Conversion Fidelity for RAG Pipelines
Conversion missteps destroy table relationships before RAG systems even retrieve them.

A Markdown table seems harmless: neat rows, pipes, dashes, clean cells. But the process of getting a table from a PDF into that format is where most retrieval-augmented generation systems quietly lose the thing that made the table useful in the first place, which is the relationship between a value and the label that explains what it means. No amount of prompt tuning downstream will solve this formatting issue. That semantic problem begins long before any retriever ever sees one chunk of text.
How the conversion step destroys semantic relationships before the retriever ever runs
Any table gets its power from showing both facts together. The number 4.2 means nothing on its own; it means something because it sits at the intersection of "Wheat" and "2026 forecast." Strip either axis away and the number is just a number, floating with no anchor. The whole proposition behind tabular stuff is two-dimensional sense encoded by placement.
PDFs lack that organization. In a PDF, what's really there is a set of steps that show the renderer how to place individual characters. The format itself has no baked notion of "column" or "row". To read any PDF table, a parser checks x and y coordinates for each character, using spacing plus alignment to figure out which characters fit inside a given box and how those boxes line up in a row. Usually the estimate lands near the mark. It can fail, failing silently: without an error or alert, just a quietly off grid that looks okay to someone skimming but reads like junk for the downstream retriever.
Once reconstruction breaks, several failures hit at once. First, row-column linking entirely disappears, and the system sees a plain run of values lacking any relational pattern to use. Next, multi-page tables lose their header past the first, leaving every later sheet an unexplained mass of numbers with nothing saying what they're about. Citation breaks: you can't send someone toward "row 47" within that table if row 47 wasn't ever reconstructed into a row. Just scattered characters sitting close together, nothing more.
Whoever made the table, someone at the bank or public office, understood the thing they were encoding. They knew the row was "Wheat" and the column was "Q3 2026" and the cell where they intersect is a forecast price. None of that means anything to the parser. The software just sees marks, and flattening the table strips out the layout the document's creator built in deliberately. The solution requires preserving a text's layout before it's flattened. Putting back the layout that was there all along, before it got pressed flat.
What the benchmark literature says about how badly fidelity actually degrades
You see how big this issue gets when you move beyond text extraction to elements that have layout. A 2025 benchmark spanning 41 PPTX documents plus 468 test questions showed that text survives conversion pipelines reliably, while graphics such as diagrams and tables lose information along the way. The format designed for folks flipping across slides won't translate by itself into what any retrieval setup needs.
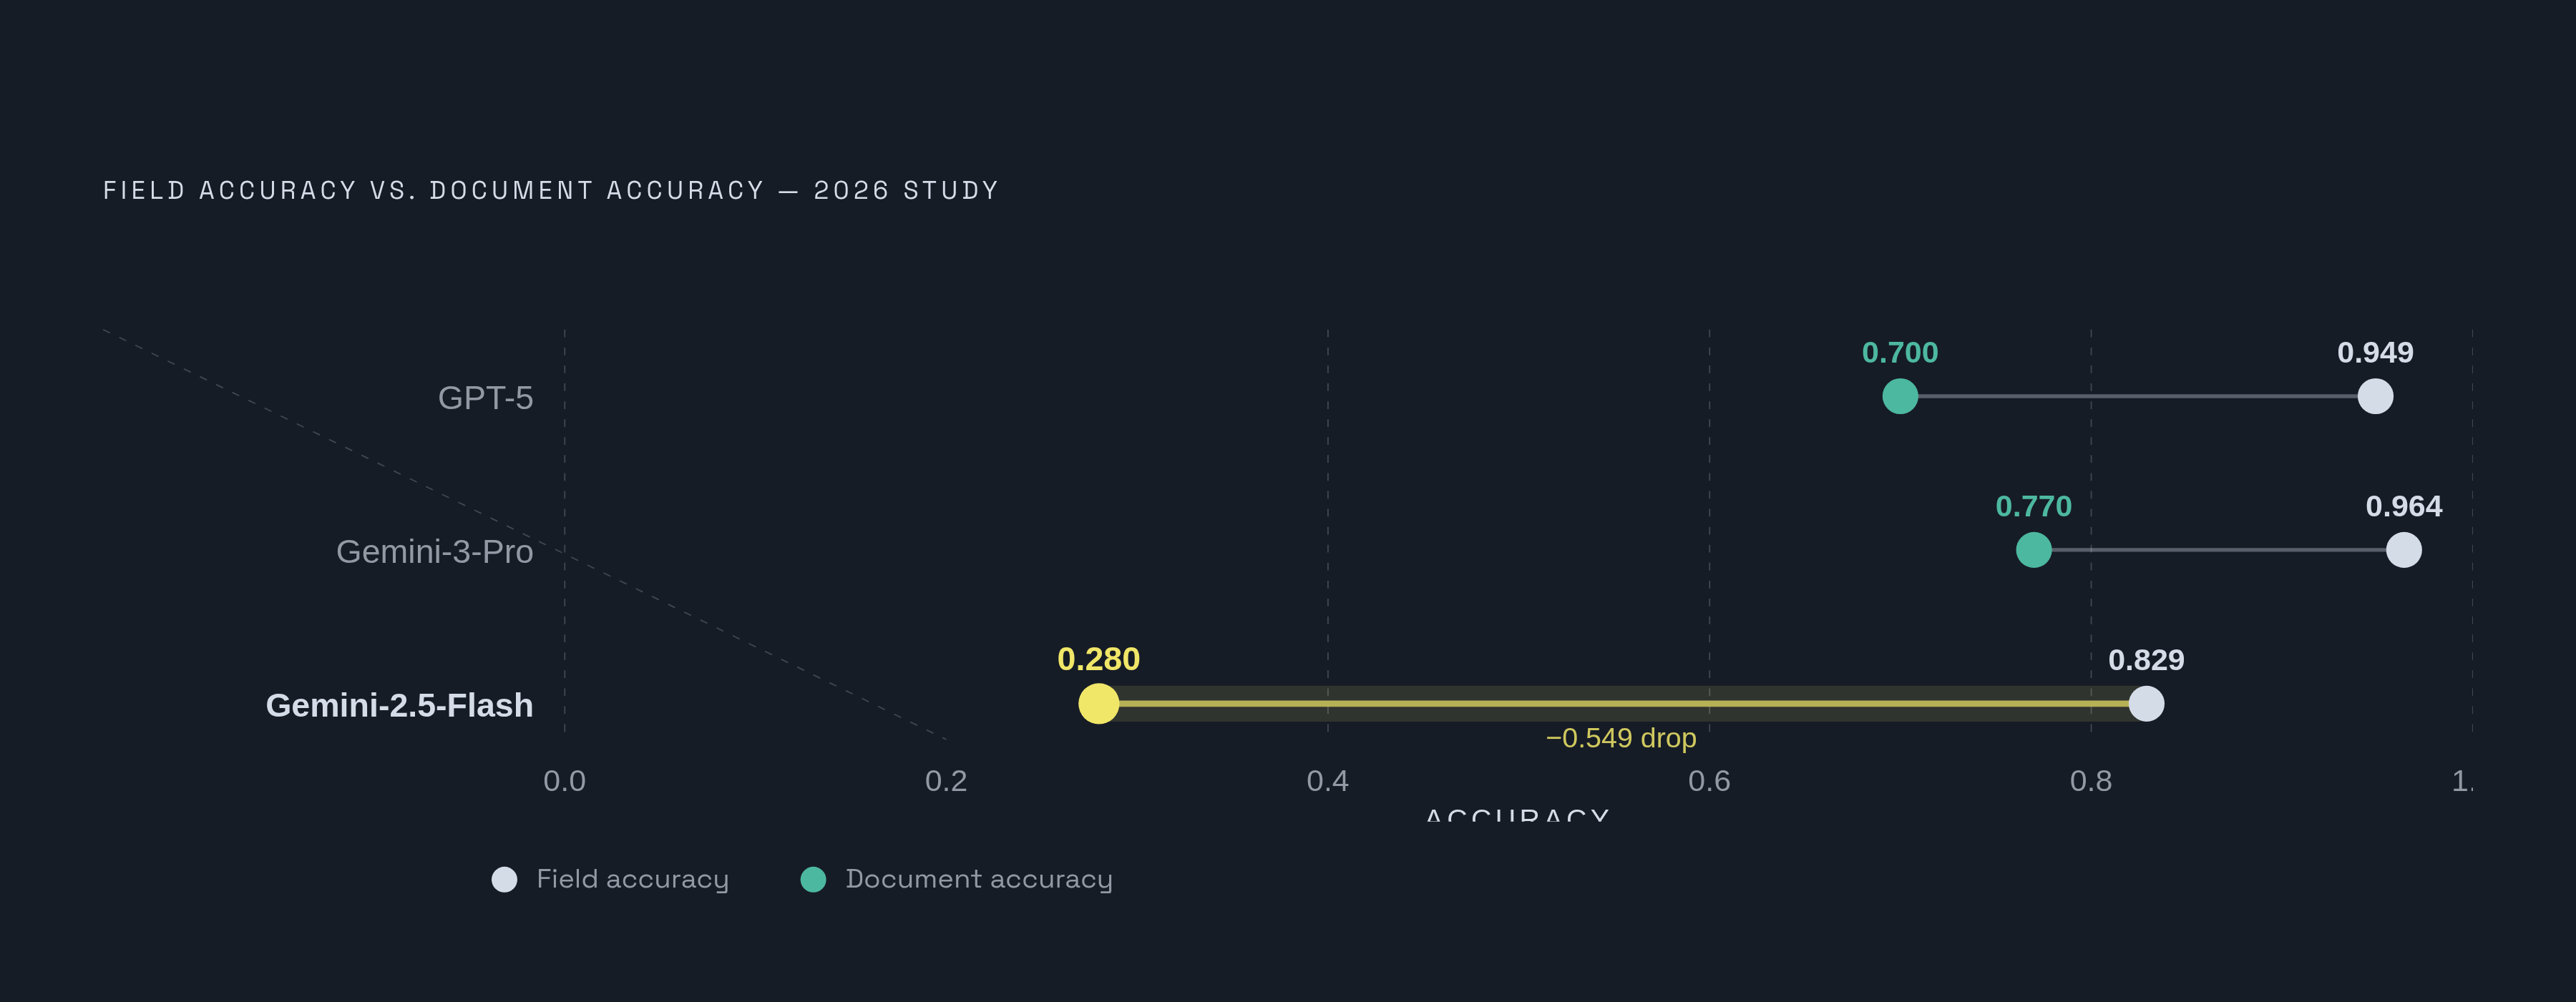
A more useful distinction comes from a 2026 study that separates "field accuracy" from "document accuracy." Field accuracy asks whether individual cells come out right. Document accuracy asks whether, after every entry gets stitched into place, the whole table still holds together as coherent. That gap is where many RAG failures show up. When pulling financial items, GPT-5 hit 0.949 for field accuracy yet dropped down to 0.700 in document accuracy. For table tasks, Gemini-3-Pro got 0.964 for individual fields, but just 0.770 when the table as a whole needed to cohere. Gemini-2.5-Flash shows this most sharply: field accuracy of 0.829 seems usable, until document accuracy craters to 0.280. Even when most cells come out right, that table loses its sense. RAG answers need the full picture rather than one single correct entry.
Studies on tables in research reach the same conclusion from another direction. Priority-based extraction hit 94.93% accuracy for tables with values as text, but it fell as low as 83.49% when numbers had to come from charts, mainly because misreadings hit values embedded inside pictures. Research into Malaysian financial documents spells out the failure mode plainly: data values plus row labels get scrambled, while item entries misalign away from their correct spots, and column header text loses its intended sense. And these smaller models do badly here specifically: Llama-3.1-8B-Instruct scored only 11% for financial tables, with 7% for law tables, showing near-total failure at producing usable structured output, a result that matters for any group reducing inference expense with smaller models on-site.
One more catch deserves a moment. One paper showed that using chain-of-thought with RAG raised outputs' structural parsability across 11 out of 12 scenarios, so Markdown came through as correctly formatted. Yet better structural results frequently got paired alongside lower accuracy. Making an output neat does not mean making the inside right; with any pipeline optimizing toward a wrong metric, results may look like they are getting better while actually going bad where it matters.
What the current conversion tooling actually produces and where each approach breaks down
Four extraction paths run through pipelines today, and each one fails differently.
With OCR, OCR tools simply read the document into characters, without structural awareness of which part counts as the table instead of text. In a two-column layout, the columns come out interleaved as one incoherent flow. Those characters got grabbed correctly by OCR, yet it lost every row and column link between Table cells, leaving bare values and skipping what matters in retrieval.
PDF text extraction libraries like PDF text extraction libraries like pdfplumber are faster and don't need a GPU, but they inherit the underlying problem directly: text in a PDF is stored as positioned character runs, not semantic paragraphs, so a library extracting "text" is really just pulling strings and their coordinates. With scanned pages, the underlying layer is missing, so they come back empty. You get individually positioned strings for Table cells, lacking any linking to tie them together.
Putting document pictures into a multimodal tool, skipping entirely structured extraction, seems as if it should fix things by having vision-capable AI “just read” it. It doesn't handle growth, plus this introduces one new failure mode: any table spanning two PDF pages ends up split into fragments the system can't tell belong together. Even worse, you get no way to tell apart a system that got it correctly from one which hallucinated something plausible given the context.
Regex-based extraction over already extracted text succeeds just one time, on the single document layout it was built to match. It breaks when another vendor's file shifts the spacing or the column layout, forcing a regex rewrite. That expense keeps coming back. That line item never goes away, scaling with each new document type any pipeline ingests.
For every approach here, cells that are merged, plus multi-level headers, cause the most trouble. One header spanning those columns is duplicated as matching strings, or it vanishes outright; after that, no downstream step can tell the sub-columns belonged under it. You can see this in the October 2025 World Bank's Commodity Markets Outlook: running a 42-row, 14-column forecast table (page 17 inside a document with 66 pages and 38 tables) through one popular extraction tool, one popular extraction tool left the numeric grid intact while dropping the Commodity column and row labels. The first slot of every row was missing. The figures showed up. What they pointed to was missing. This is how you get an answer that seems sure but is entirely off. A retriever grabs that chunk, the system reads actual numbers from the document, but the single fact giving those figures context didn't survive into it.
Two main paradigms tackle this. Pipeline-based tools run layout models that first split a document into parts, then send each area type on to its own processor. Instead of doing segmentation, End-to-end vision-language models treat the whole document as a picture, producing Markdown right away. Both approaches have weak spots, and pipelines tend to miss how much the tool matters.
By mid-2026, benchmarking for table fidelity shows that Microsoft's MarkItDown tool, this lightweight open-source package with over 174,000 GitHub stars, hits 82% F1: it handles 100 pages in 12 seconds without a GPU, works on basic tables, yet degrades when layouts grow complex. The privacy-first, open-source Docling scores about 88% F1, beating MarkItDown on layout. At about 92% F1, LlamaParse ranks highest when table fidelity is critical.
Evaluations show that no single tool handles every document type best. Strengths and weaknesses varied by document type, so they picked this multi-strategy setup over any single default tool.
Vision-language models give you another route, yet they still come carrying a quirk: the vision variant of some vision-language models occasionally replace exact figures with descriptive prose, losing precision. Going sequential, parsing layout first before handling asks about it, usually works better than having the system view the picture and reply at once. For high-stakes work, a setup combining structured parsing alongside vision fallback remains the most defensible option.
A quieter point that matters: for identical table data, Markdown needs roughly 40% less tokens compared to HTML while leaving structural information intact. That adds up fast in any document set holding many tables. Regardless of which tool you pick, a solid parser must keep tables, headings, bullet points, captions, part breaks, and how text pairs with visuals in the right sequence, not just match individual characters. While evaluating options, have vendors share structural similarity scores and Character Error Rate specifically against Markdown output. Basic OCR recall figures miss whether row-column relationships held up.
The four levels at which a table can live in the pipeline, and why the choice determines retrieval quality
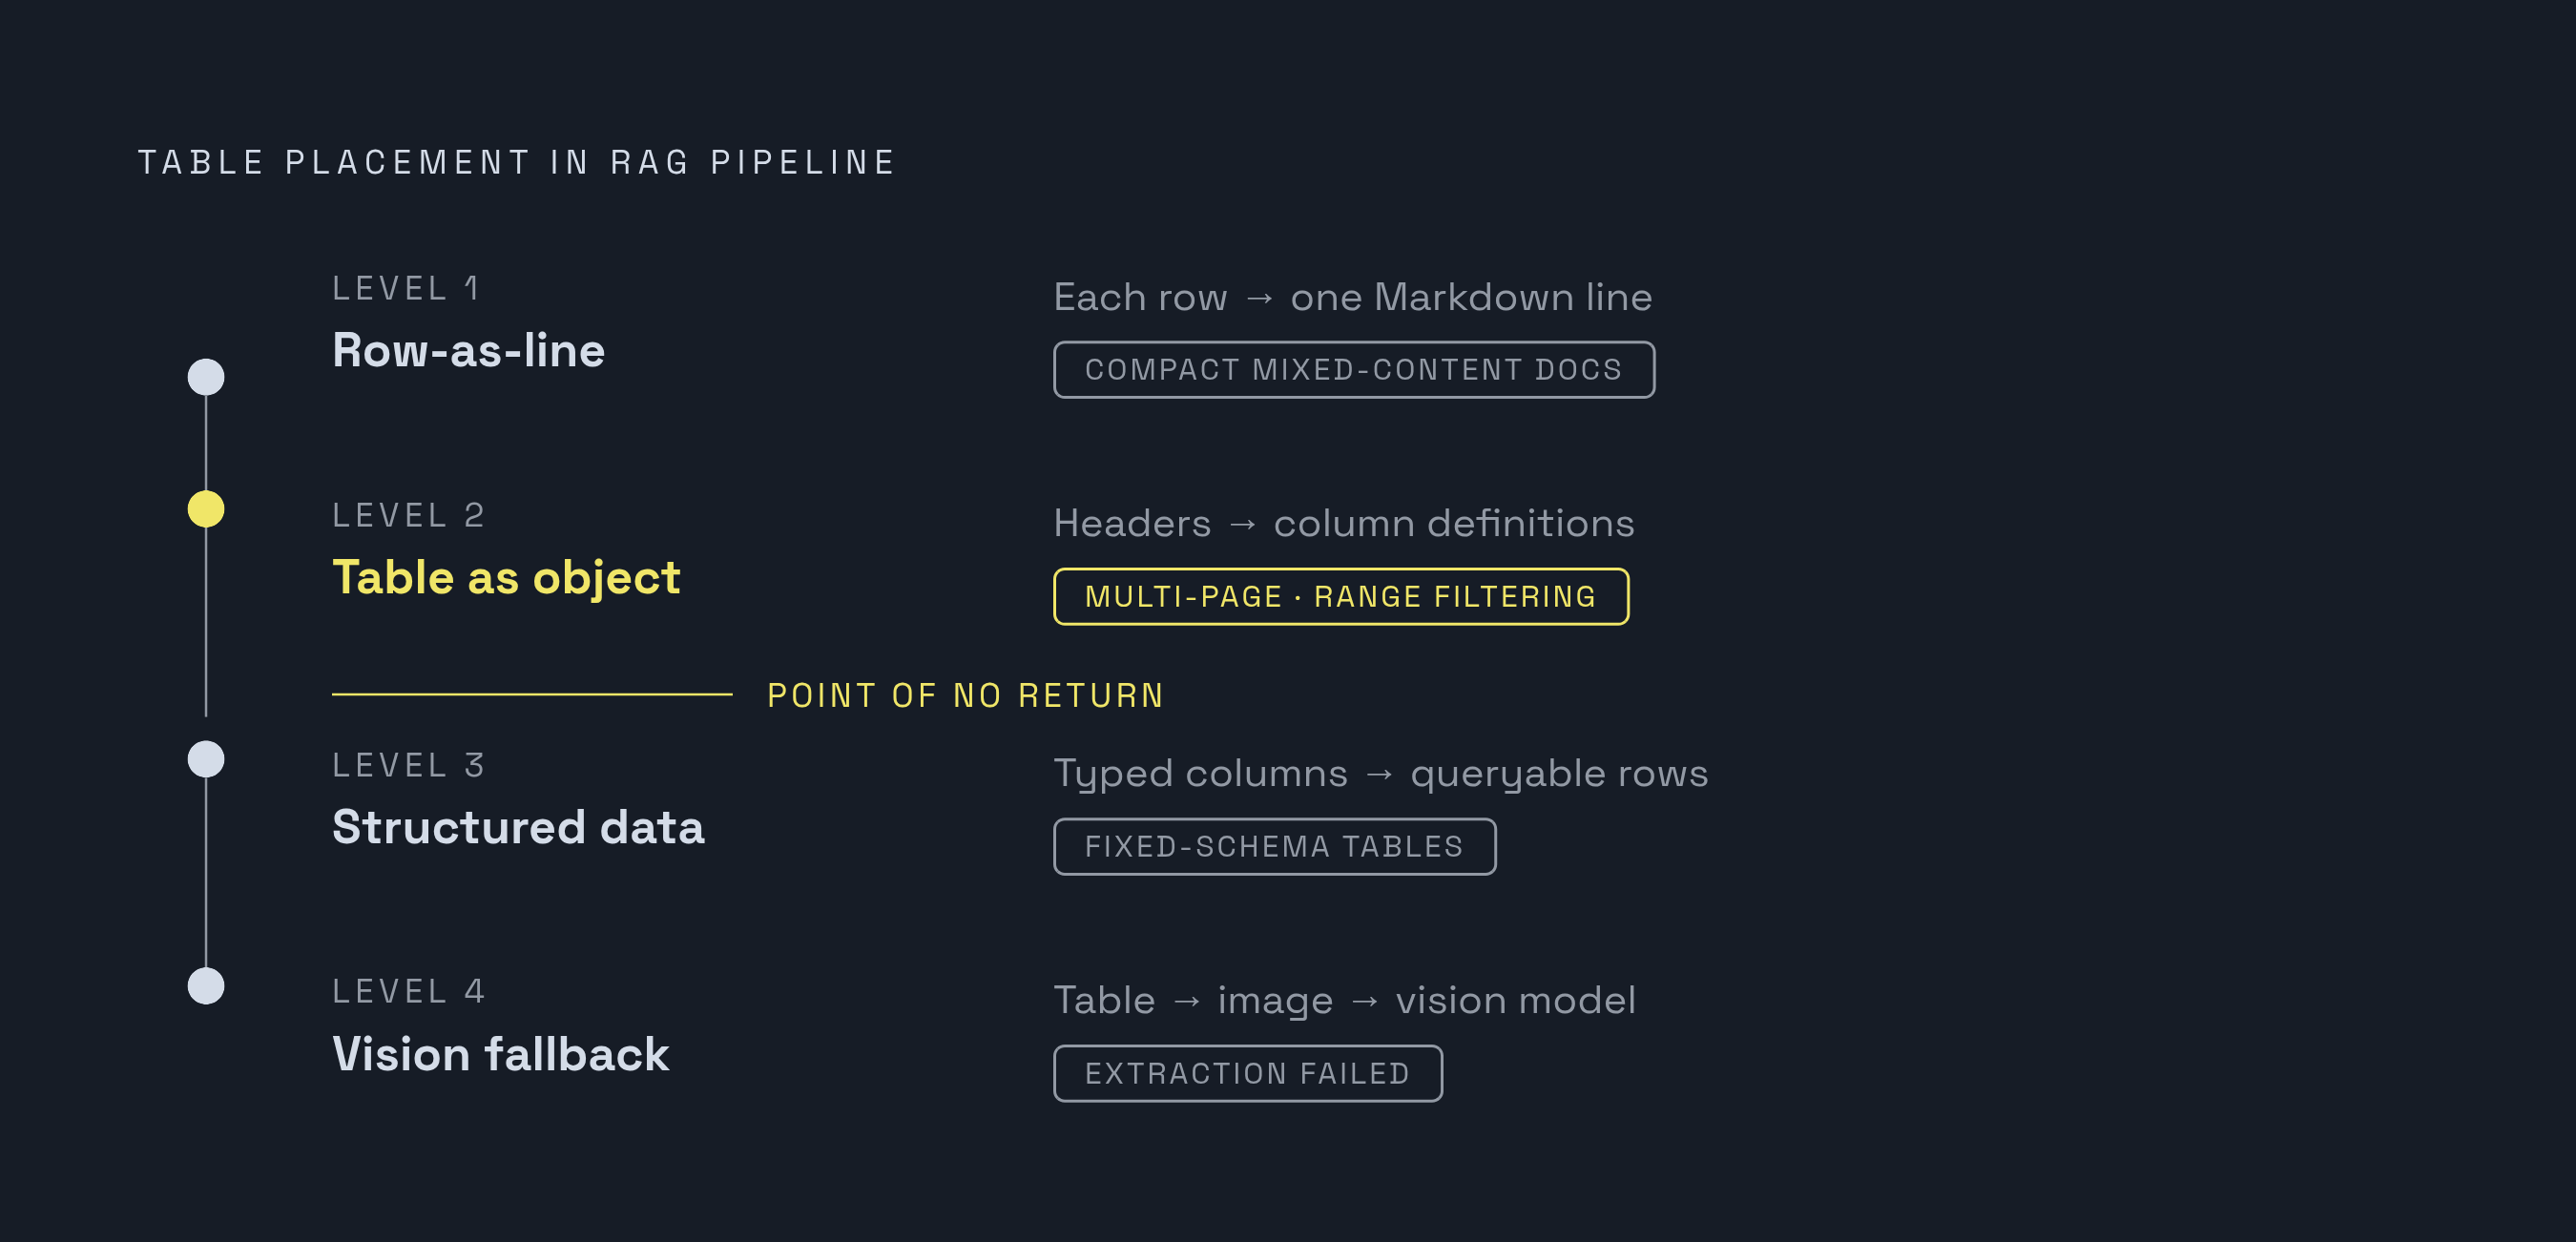
A table can sit across four levels within the RAG pipeline; keep that call deliberate, not left to parser defaults.
Most parsers, left to themselves, produce the first kind, row-as-line: every table row turns into one Markdown table line, embedded within the text of the surrounding document. This handles plenty of tables, particularly compact ones nested inside mixed-content papers where answering a query follows the same path whether the source is a single sentence or one row.
At stage two, that table lifts out entirely as its own object, keeping headers as real column definitions instead of duplicated text. It's required as soon as a table spans several pages with its header shown once, or when rows must be narrowed by range or columns pulled out. Once that table gets flattened to disconnected Markdown, no amount of prompting can make it un-flattened.
At stage three, some tables become structured outright: typed columns go back to their columnar shape during ingestion, stay that way, and get queried instead of being parsed like text. This counts most when tables recur throughout one document set sharing a fixed schema, rate schedules, financial earnings summaries, compliance tables that appear in submission after submission. Keeping them as data rows instead of plain text opens up the kinds of questions a retriever can actually handle.
If the earlier approaches aren't achievable, you can send that table as a picture into vision software, but only if structured extraction truly won't work. Which of the four levels to pick should depend on table dimensions, schema consistency between documents, and what people will actually query, not on the extraction tool's default output.
A financial report question like "what happened to consumer revenue in Q3?" makes the stakes concrete. Getting that right correctly using one single retrieved chunk requires a title, plus the full table itself and explanatory sentence after that table, to stay together through extraction in that chunk. Split them up and you end up with an incomplete reply, or one that's confidently bad.
Tables that span multiple pages need separate treatment, since this failure is structural. When the header appears only on the first sheet, each following one becomes a plain grid of numbers and can't tell what they track. You need to handle this when building the format, long before anyone thinks about chunking.
Why chunking strategy is the second place table fidelity is destroyed, and what the evidence shows about which approaches hold up
Even a clean extraction isn't the whole story. In chunking, a correctly reconstructed table might yet be sliced up and broken all over again.
Splitting text with different methods on one document set can drive recall results nearly nine points apart. In a real help desk, this gap separates a tool that can actually answer things from one which frustrates users.
Studies show that across document sets, semantic chunking can underperform fixed-size chunking, on retrieval as well as on the responses it produces, so the additional computation it requires bought itself nothing. Semantic chunking carries its own distinct red flag: a Chroma evaluation reported 91.9% retrieval recall with semantic chunking, yet the FloTorch benchmark tracking end-to-end accuracy for that method landed at just 54%, 15 points lower than recursive splitting. This traces to how short each fragment is: chunks averaging 43 tokens lack the context needed for building a proper response, even if retrieval picked the right one.
Hierarchical chunking is the go-to setup in deployed systems for good cause: compact chunks give precision at query time, and when one of them hits, the bigger paired chunk comes along too, giving pinpoint targeting plus the surrounding context it takes to actually make sense of what came back. Among pipelines built for retrieval precision plus strong output, this setup is used most because that resolves its tradeoff without choosing one option. A real setup took one help desk to 52% retrieval accuracy with naive 1,000-token chunks, then hit 89% just by trying Markdown-aware splitting instead, keeping the same LLM, vector store, and prompts. Just the split locations moved.
With tables, the guidance stays straightforward: keep every row linked to the header. Make a table an atomic block, kept whole in one chunk or placed in a larger section with hierarchical chunking. A usual overlap of 10 to 20% across chunks (some 50 to 100 tokens for a chunk of 512 tokens) limits information loss where chunks meet, and that matters a lot when the table's meaning sits in the document right after it and would land in another chunk entirely without the overlap.
For hard tables and high-stakes cases, contextual enrichment pays off: have AI write about each table after analyzing that table itself plus nearby document text, then put that beside its table's Markdown in one single chunk. It runs up a bigger bill, because each table needs an additional LLM pass, though on tables where errors actually matter, that expense is justified.
How to evaluate whether a pipeline is actually maintaining fidelity, rather than assuming it
Assuming a pipeline handles tables correctly because it "looks fine" in a spot check is how most of these failures go undetected until a user notices the answer is wrong.
RAGAS offers four areas to check, specifically with table-heavy document collections. Faithfulness checks if what's retrieved lines up factually with what got produced. Context precision checks whether the retrieved material actually matches what was queried. Relevancy checks whether what came out actually fits what was asked. For Context recall, it checks whether what the retriever gathered covers all required material to fully respond, rather than only some.
With tables specifically, request accuracy metrics on Markdown output rather than numbers for generic OCR recall, because OCR recall can't show whether the row-column relationships survived conversion. Build your evaluation using that field-versus-document accuracy split: testing if individual cells are right isn't the same as checking whether a table holds together as a whole, plus RAG answers require an entire table intact rather than a few correct cells scattered through it.
Before release, test a typical set against the problems that can actually harm pipelines: tables using merged cells plus multi-level headers, tables spanning several pages, tables where figures depend on hierarchical headers, and tables beside pictures and diagrams, as detailed layouts add information loss beyond that table itself.
When handling a new document type, reusing that World Bank validation heuristic means looking specifically at the column holding row-label data. When a numeric grid survives intact but its row labels go blank, the parser has silently dropped the only field making those numbers make sense. You're running a structural test instead of a numerical one, so it catches failures a strictly numeric accuracy review would overlook entirely.
If your pipeline processes multiple clients' documents, you're not able to run validation a single time and consider it done. A tool that performs reliably with a client's clean, digitally-produced PDFs might degrade badly when processing a client's scanned financial statements, so you can't know that except by testing every client's document set individually.
How agencies running multi-client RAG pipelines should structure the fidelity problem across a portfolio
That PPTX benchmark result generalizes further than one test: documents made for people, decks, analyst write-ups, deliverables for client accounts, all feed into AI working in the client's interest as well, and whatever formatting a document had from the start sets what that AI can tell users. A firm producing client-facing analysis using one RAG-backed tool inherits all the setup's formatting choices, whether it created them or not.
Running a full portfolio turns that field-accuracy-versus-document-accuracy gap from a theoretical curiosity into real danger, multiplied inside each client corpus your pipeline handles. One that hits 0.964 across individual fields yet posts just 0.770 in whole-document coherence, with 0.829 falling to 0.280 at the low end, doesn't fail alike from one client's documents to the next. Some client's tables are straightforward, built as row-as-line entries that pass through conversion without trouble. For a different client, tables might be dense, financial schedules, having merged headers plus multi-page spans, where fidelity collapses most. Running one single default pipeline configuration uniformly through a portfolio works fine for certain accounts but fails badly on the rest, and no standard dashboard screen will catch this unless your team builds structural validation checks into each client workflow instead of doing it once covering that whole group.
So fold table fididelity testing into a recurring line item aligned with each client's document types, instead of a setup task done one-time when a client is onboarded. If a customer starts using different software that leaves their financial records formatted another way, or new document formats and templates show up, your pipeline might show accuracy differences between tools, such as 92% and 82%, so you have to test regularly.
Sources
- Meet Your New Client: Writing Reports for AI -- Benchmarking Information Loss in Market Research Deliverables
- How to Install MarkItDown in Claude Code and Claude Desktop (MCP Guide)
- Fine-Tuning Vision-Language Models for Markdown Conversion of Financial Tables in Malaysian Audited Financial Reports
- arxiv.org