OCR Confidence Scores as a Triage Signal in Production
Confidence scores route OCR extractions, but only if thresholds match the document type and risk.

An OCR confidence score answers one question: what should happen to this extraction next? Let it through, flag it for a person, or bounce it back for re-capture. People often ask a second question of it anyway, which is how accurate the extraction actually was, but the score wasn't built to answer that. That confusion is where pipelines break, and they tend to break quietly, months after launch, when someone finally audits the review queue and finds it stuffed with documents that never needed a human in the first place.
Strip the jargon and a confidence score is a number between 0 and 1 that an OCR engine attaches to whatever it just pulled off a document: a character, a word, a field like an invoice total. Granularity matters more than most teams give it credit for. A system that only scores at the page level cannot tell you which of forty fields on that page is the shaky one; it just shrugs at the whole page. Field-level scoring gives routing logic something to grab onto. Page-level scoring gives it a vibe, and vibes make poor routing rules.
The score comes out of pattern recognition: how clean the font looked, how degraded the scan was, how well the extracted text matched what the model expected to see. Feed the engine a crisp, digital-born PDF in a familiar font and it stays confident. Feed it a fax from 1997 and it hedges, which is exactly what it should do, because a fax from 1997 has earned that hedge.
Sarkar and Baird showed back in 2001 that this signal is usable at all, treating the OCR engine as a black box and finding that confidence scores alone were enough to sort pages by estimated accuracy without ever peeking inside the model. That result still matters: the number does real work even when nobody can fully explain how the engine arrived at it.
Here is the tension the rest of this piece keeps circling back to. A confidence score is a self-reported estimate. It does not compare across different OCR engines, since each one calibrates its own certainty differently, and it does not hold steady across document types unless someone checks. A high confidence score on a printed invoice and the same score on a handwritten intake form carry different claims about reality. One of them deserves far more trust than the other, and the number alone will never tell you which.
The three-zone routing model and how thresholds map to operational decisions
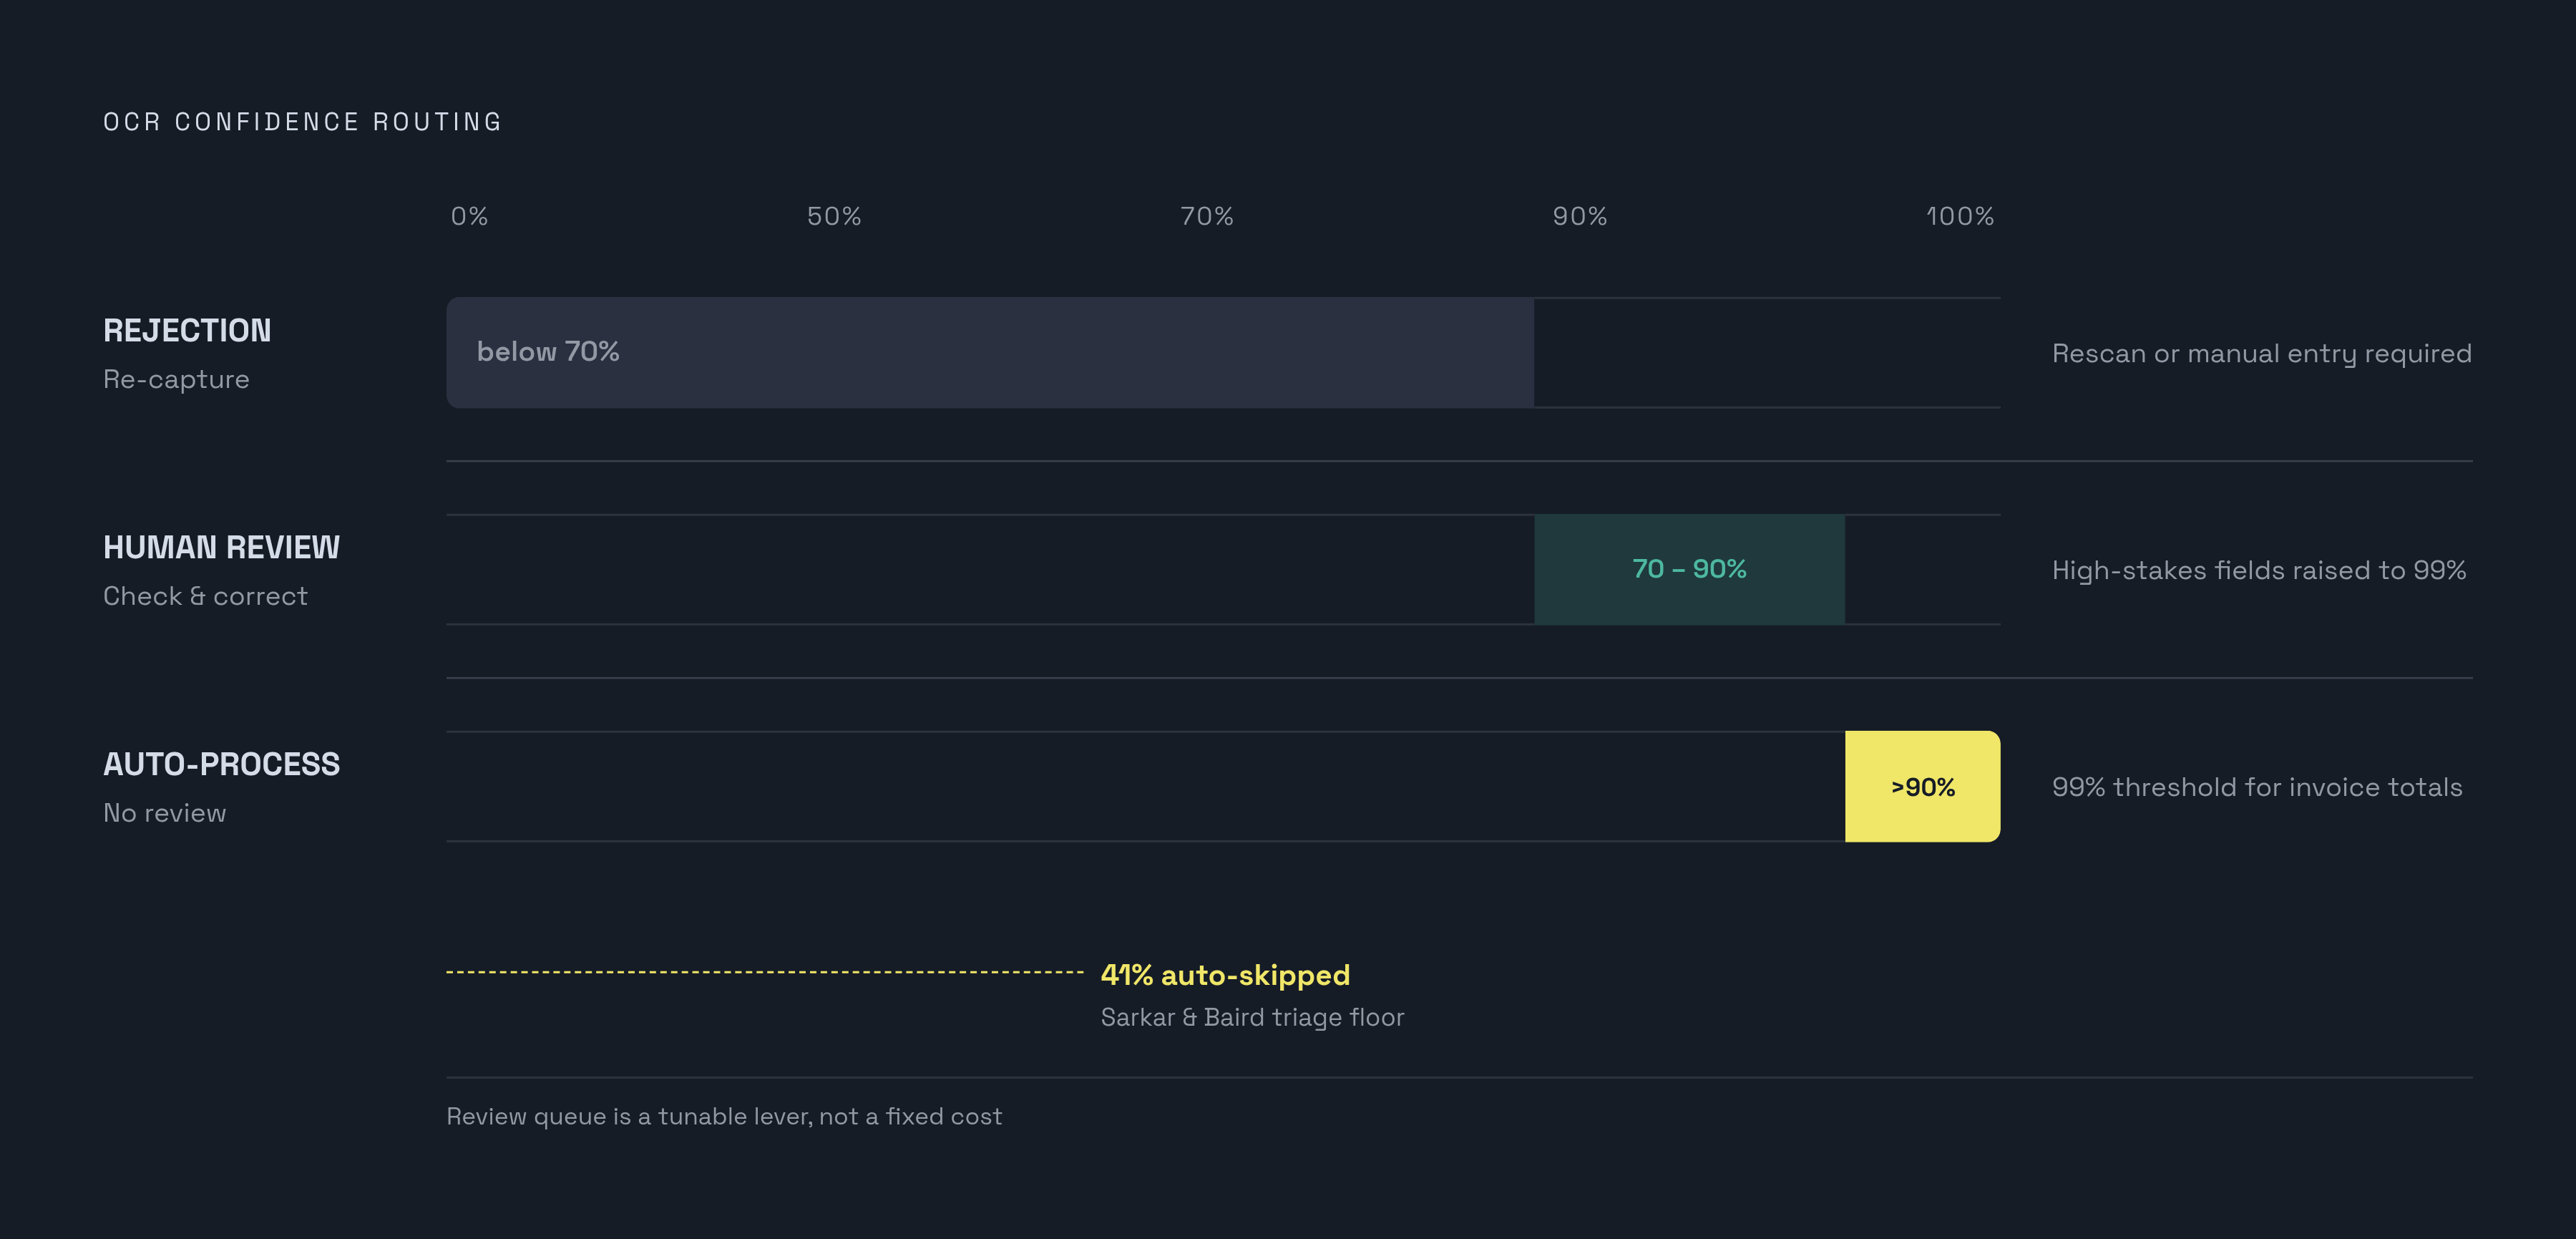
Pipelines that use confidence scores well run three zones. Skip this step and you become the team explaining, later, how something expensive slipped through untouched.
Zone 1 is auto-process. Anything above the high threshold moves downstream with no human in the loop. A common starting point is 90% confidence, though financial workflows often push that to 99% for a field like an invoice total, since a wrong number there costs real money and nobody wants to be the one explaining that to finance. Secondary fields, the ones that do not move dollars around, sometimes clear at 90% instead. A widely used rule sets the auto-accept bar at 95%, provided validation checks also pass, because confidence rarely carries the whole decision on its own.
Zone 2 is the human review queue, usually the 70 to 90% band. This works best as a check-and-correct task rather than a re-key-from-scratch task; treat it as the latter and the entire point of a middle zone evaporates. A reviewer glancing at a near-certain extraction to confirm or fix it moves faster than someone typing a field in cold, which is the whole efficiency argument for calibrated routing in the first place. Zone 3 is rejection, typically below 70%, meaning the document needs a re-scan, a different capture method, or a human keying it in from scratch.
Field-type differentiation matters as much as the zone boundaries themselves. A patient identifier or a financial total is high-stakes, so the auto-accept bar sits conservatively; handwritten text below 95% belongs in review no matter what the general rule says. A secondary reference number can afford to be looser, maybe auto-accepting printed text at 85%, because getting it wrong there does not break anything downstream.
Sarkar and Baird's results give a useful anchor: their triage model skipped manual inspection entirely for 41% of documents in the validation set. That is not a ceiling, and it will not hold across every document mix, but it is a reasonable floor for what a tuned three-zone system should manage at minimum. Touch rate is how a team checks its zones day to day without re-running an academic study every quarter. For a clean digital document mix, somewhere between 80 and 90% of files should clear zone 1 untouched. Fall meaningfully below that and something is off: either capture quality degraded, or the tool does not match the document mix it is being asked to process.
How document type and capture modality shift where those thresholds should sit
A single threshold applied uniformly across everything a pipeline ingests does not survive contact with how wide the accuracy spread gets by modality. Most teams tune one cutoff for "OCR" as a category, as if a phone photo of a receipt and a vendor-issued PDF invoice belong to the same risk class. That mismatch is where the trouble usually starts, and it is avoidable trouble.
Clean chat screenshots, email captures, mixed-UI screenshots, label and receipt photos, handwritten or blurry captures: pass rates drop sharply as you move down that list. Invoice OCR alone spans from the high 70s on scanned, complex, multi-page documents up to the high 90s on digital ERP-generated ones. Two invoices can look nearly identical to a person flipping through a stack and still sit in entirely different risk zones before any routing logic even fires.
Healthcare offers a useful calibration case, if only because the stakes force some rigor. A multi-center study found OCR-based ICU data entry reaching 98.5% data completeness and 96.9% data accuracy across multiple types of medical devices, numbers strong enough to justify trusting automation broadly. Yet a high average does not excuse a loose rejection floor. When the downstream consequence is a misread dosage field, the floor gets set conservatively regardless of how good the average case looks. Arguing for a looser floor because "the average is fine" optimizes for the wrong metric entirely.
Handwriting deserves its own line. Treating a handwritten field the way you treat a printed one ranks among the most common threshold errors in this discipline, and it is entirely avoidable. Advanced ICR, intelligent character recognition, reaches somewhere in the mid-to-high 80s to low 90s on complex or cursive text, which sounds respectable until you notice the best case for handwriting lands squarely inside the review band anyway. Ninety percent confidence on a handwritten field is not a safe auto-accept signal, full stop.
Segment the document corpus by type before setting a threshold anywhere. A pipeline handling both digital-born PDFs and handwritten intake forms needs routing rules that know the difference, because one global cutoff cannot account for how differently those two document types behave.
Why a raw confidence score is not a reliable routing signal without calibration
Here is the uncomfortable part: a score of 95% only means something if the engine is actually right 95% of the time it says that. Often it is not, for reasons documented well outside OCR specifically.
Neural networks tend toward overconfidence. Modern neural networks are well documented to systematically output confidence higher than their actual accuracy warrants; a model claiming 95% confidence may, in practice, be correct significantly less often than that. Flip that around, though, and some models underconfide on easy cases, reporting lower scores than the actual output quality warrants, which just bloats the review queue with documents that never needed a second look. Confidence does not track cleanly with accuracy either. A model can be more accurate at 85% confidence than at 90%, thanks to quirks buried in its training data, which quietly undercuts the whole premise that a higher score means more trust.
One example makes this concrete. In a retail bill digitization pipeline, running CNN-enhanced preprocessing ahead of Tesseract dropped the reported confidence score materially. Read cold, that looks like a regression. The actual text quality, measured properly, improved on the metrics that count for downstream extraction. The confidence drop was an artifact, a mismatch between the preprocessed pixel distribution and what Tesseract's internal estimator expected to see, rather than a real decline in output quality. A pipeline routing on raw scores alone would have flagged that improvement as a red flag and shipped the worse, higher-scoring extractions straight through untouched.
Call that the confidence-quality inversion problem. It is the reason raw scores cannot be trusted out of the box: routing on them means routing on the engine's opinion of itself, a separate thing from what actually came out the other end.
Calibrating confidence scores against ground truth before trusting them in routing
The fix is to check the engine's opinion of itself against reality. Process a sample of documents where the correct answer is already known, plot the engine's confidence scores against the accuracy it actually achieved at each score band, and look at the shape of the curve. A straight diagonal line means the engine is well calibrated. A curve that bows one way or the other means the scores are systematically over- or understated for that document type, and now there is a number for by how much.
Skip this step and every threshold in a routing design becomes an unverified assumption dressed up as a rule.
One common measurement is Expected Calibration Error, ECE: the average gap between what the model predicted and what actually happened. A perfectly calibrated model scores 0, and a reasonable operational trigger flags the pipeline for recalibration once ECE crosses a predefined threshold. That gives a team a number to watch instead of a vague sense that something feels off.
Calibration does not transfer across document types, and that is worth repeating because it is the mistake most likely to slip through unnoticed. A curve built entirely on digital-born PDFs tells you nothing reliable about handwritten intake forms; the segmentation used for calibration should mirror the segmentation used for setting thresholds in the first place. Run the calibration once per segment, and it shows which score bands can actually be trusted for auto-processing, which ones are genuinely uncertain no matter what the raw number claims, and whether the real rejection floor sits higher or lower than the nominal one suggests.
Manual data entry alone tends to carry something like a 2 to 3% error rate. Calibration is the mechanism that gets an automated pipeline meaningfully past that baseline, reliably, instead of hoping the raw scores happen to line up on their own.
Monitoring confidence score distributions in production to catch drift before it becomes an accuracy problem
Calibration is a snapshot. Production is a moving target, and document mixes shift under a pipeline's feet whether anyone is watching or not.
The distribution of confidence scores across a pipeline's output works as a leading indicator, catching trouble before accuracy metrics get bad enough to trip an alarm on their own. What does drift actually look like day to day? A slow creep in review-queue volume with no matching rise in document intake means the auto-process band is quietly shrinking, a sudden spike in low-confidence documents usually means a new format or capture method just entered the pipeline that the engine has never seen before, and a confidence histogram that shifts left over time with no change in the underlying document mix is a fairly blunt signal that the model itself is degrading, separate from anything happening upstream in the document supply.
The retail bill digitization case from earlier gives a useful reference point here too. A healthy confidence histogram for that document type showed strong concentration in the mid-to-high confidence bands, with relatively few documents falling into the low zone. Monitoring, in practice, means watching for that concentration to erode, thin out, or spread toward the tails.
Operationally, that means tracking the share of documents landing in each zone over time and alerting when the distribution drifts materially from the calibrated baseline. Recalibration should get triggered by any of a handful of events: a new document source coming online, an OCR engine update, a change in capture hardware or scanning DPI, or an ECE reading crossing that 0.03 threshold again. The monitoring layer is what separates a routing system that got tuned once and left alone from one that stays trustworthy as the pipeline, and the documents flowing through it, keeps changing underneath it.
Translating the framework into a practical implementation sequence
Put the whole argument into motion and it comes out as six steps, roughly in order.
Segment the document corpus by type and capture modality before touching a single threshold value. Routing logic built before segmentation will be wrong for most of what it eventually sees, no matter how carefully the thresholds themselves get chosen afterward. Next, run a calibration sample for each segment: build the confidence-versus-accuracy curve, compute ECE, and pin down what each score band actually means for that particular type of document.
From there, set thresholds per segment and per field risk level rather than reaching for one global cutoff. Reasonable starting anchors: auto-process above 90% (higher for high-stakes fields), a review band between 70 and 90%, rejection below 70%. Adjust those anchors based on what the calibration curve actually showed. If the engine runs overconfident for a given segment, raise the auto-process floor to compensate; the 90% starting point works as a baseline to test, not a fixed rule to defend.
Define what each zone means operationally: a specific queue, a named reviewer role responsible for it, a service-level expectation for how fast the review band gets cleared. Then instrument the pipeline to track zone distribution over time, alert on ECE drift, and put recalibration on a defined schedule as well as tying it to trigger events like a new document source appearing.
Treat touch rate as the ongoing health check. For a clean digital document mix, 80 to 90% clearing the auto-process zone is the expectation. Deviations from that range are diagnostic: they point to capture quality, a miscalibrated threshold, or a new document type that snuck into the pipeline without anyone updating the routing rules for it.
Speed and reliability work together here, and that is the part worth sitting with. When routing logic is grounded in a signal that has been checked against reality, the high-confidence majority moves through fast, and the limited supply of human attention gets spent exactly where it changes the outcome. That is the whole framework: a sharper way of deciding when to trust the OCR engine already sitting in the pipeline, built on evidence about its actual performance and measured against its own self-reported opinion.